Weekly outlook · Nov 2 – Nov 6, 2026
Election week: a bounce needs follow-through
- Mon
- Tue
- Wed
- Thu
- Fri
Daily log · newest first
·Cowboy (owner)Jobs day inside the buy box: three paths for Friday
What changed
Thursday answered the question the weekly posed, and not the way we wanted. Wednesday’s post-election rally reclaimed 7,600 and closed at 7,688.62 — the recovery test was on. Thursday took it all back and more: a 4.36% drop to 7,353.73 that swept through the 7,555/7,550 pair, 7,500, and the 0.236 retracement at 7,462.4 in a single session, leaving the Nasdaq Composite in correction territory (Kansas City Star). That’s the base case winning so far: overlapping swings, wave (4) unfinished. It is not the red case. The 0.382 at 7,243.3 and the rising channel are intact, and the hard invalidation is far below.
We’re now trading inside the retracement area we marked last week for exactly this reason — somewhere to watch for stabilization, not a reason to buy a falling market.
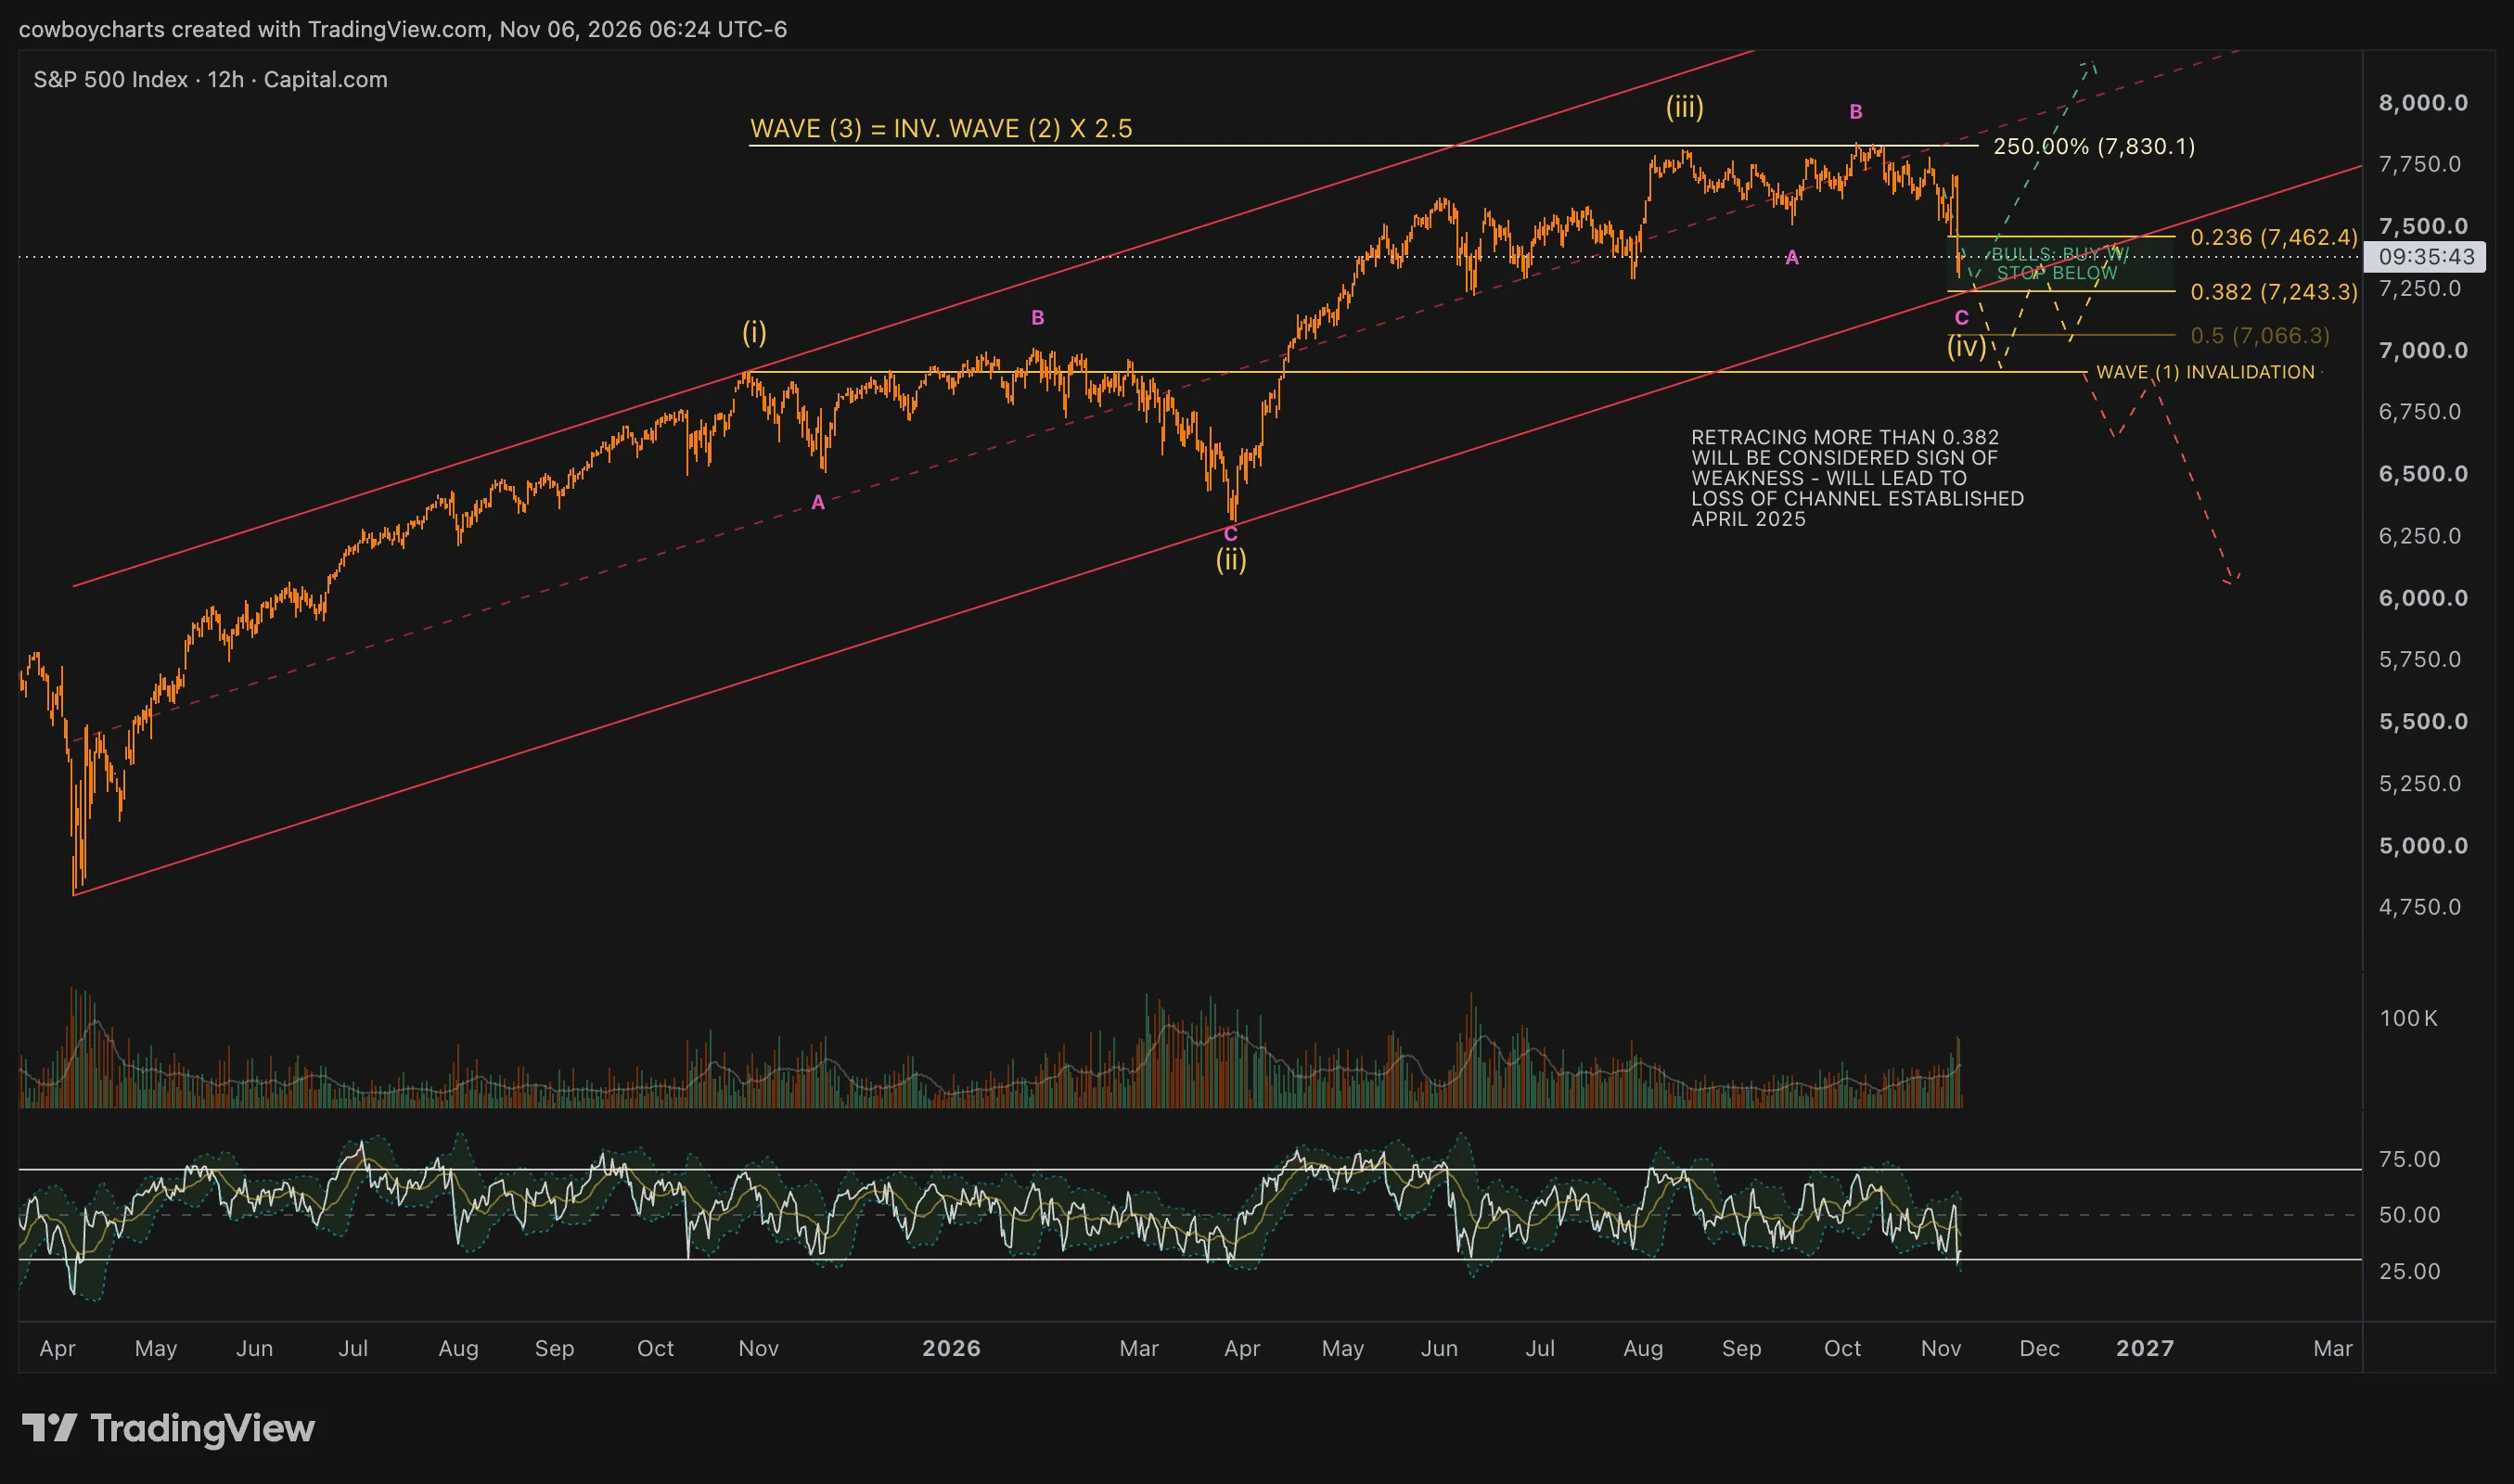 S&P 500 12h · Capital.com · Nov 6, 6:24 am CT
Cowboy’s original chart, annotations unchanged. This is a CFD feed, not cash SPX or CME ES — ES futures near 7,396 this morning are a separate instrument (Reuters).
The premarket picture
Futures are mixed: ES up about 0.3% near 7,396, Nasdaq-100 futures up 1.4% on a chip bounce (Micron, AMD, Intel and Broadcom marked 5-8% higher), Dow futures down about 0.7% (Reuters). VIX is easing, near 26.4 after Thursday’s 28.18 close (OptionsPilot). The 10-year yield backed off to about 4.84.
The catalyst lands at 7:30 am CT, an hour before the open: the October jobs report, with consensus around 59,000-65,000 payrolls added and unemployment holding at 4.2% (Kiplinger). Traders are pricing better-than-even odds of a December rate hike (Reuters), so a hot wage number is the obvious risk to a bounce. It’s also weekly options expiration, and Michigan sentiment follows at 10:00 am CT.
Three paths for Friday
Hold and recover. The first job is defending Thursday’s low at 7,350 — which also happens to be the dominant negative-gamma strike in Thursday’s close snapshot. A bounce that clears and holds the 0.236 at 7,462, then faces the 7,485/7,510 negative-gamma cluster and 7,500 itself, would start repairing the structure. What earns trust is the same test as last week: not the size of the open, but whether the first pullback after it holds. Tech leading the bounce and keeping it is the NQ confirmation we asked for.
Chop into expiration. The close sits in a ten-point hinge: negative gamma at 7,350, positive at 7,360. Pinning between them into the afternoon is a quiet outcome that changes nothing — overlap, no new labels, wave (4) still working.
Lose the box. If 7,350 gives way and fails to recover, the next positive-gamma node is 7,300, and then the line that matters: 7,243.3 at 0.382, where the channel also sits. The chart’s own note is the rule — retracing more than 0.382 is a sign of weakness that leads to loss of the April 2025 channel. That is the first structural warning, not the hard invalidation; wave-(1) territory is a different conversation and we are nowhere near it.
Positioning
Thursday’s close snapshot (3:00 pm CT, displayed price 7,353.79) shows why 7,350 is the day’s hinge. The near-term view covers the last two sessions of the November 2-6 subset — yesterday’s and today’s expirations — and in that book 7,350 carries the dominant negative-gamma bar on the board, with positive gamma stacked just above at 7,360 and again at 7,330 and 7,300. The all-expiration view keeps 7,350 dominant, expands 7,340, and adds negative clusters at 7,480 and 7,510 — the ceiling above the 0.236 — with positives at 7,520 and down at 7,220. These are market-maker gamma signs, not support and resistance forecasts (Unusual Whales interpretation guide). Last week’s ladder — 7,600 pivot, the 7,555/7,550 pair, 7,500 — is now 150 to 350 points overhead. Today’s map is the new one.
Gold: short into the wait, long target unchanged
The November 4-5 timing window came and went without the pullback — gold rallied instead, with futures running from roughly 3,899 last Friday to about 4,080 this morning, after touching 4,155.8 at Thursday’s high (Yahoo Finance). The calendar expired; the structure didn’t. We are short with a stop above the recent highs — the correction is not confirmed complete, so we’re positioned with the working W-X-Y-X-Z count, not against it. If that stop is hit, it tells us the correction may be resolving upward, and we reassess rather than widen the risk.
The long target is unchanged: we still want the 3,755-3,770 zone for a long, and the W-X-Y-X-Z structure stands. It’s a price-only watch now — if the market comes back to the zone, the original entry logic applies. The intended instrument is spot gold; the stop and target must be checked against the spot quote used for execution, not the futures prices above.
One for the map, humbly
We’re not going to pretend we called a 4% day. We didn’t, and nobody honest did. But with most of the timeline leaning bullish into the election, this space said the correction was unfinished and drew the map anyway: watch the 7,555/7,550 pair, then 7,500 if the recovery failed, and treat the 7,462-7,243 retracement area as the place to look for stabilization instead of buying a falling market. Thursday closed at 7,353.73 — inside that box, above the 0.382. The furus calling for new highs got a 4.4% education instead; no bell rings at the top, but the levels did their job.
Credit where it’s due, and debit too: Wednesday’s 7,600 reclaim was real and we gave the recovery its chance, and the base case winning is not the same as a crystal ball. If Friday rips, the caution costs us — that’s the deal. The honest grade comes Sunday with the review, misses included.
Watching
The jobs print and the first pullback after the open; the 7,350/7,360 hinge; whether chip leadership survives into the close. No next-week forecast today — that’s the weekend’s job, along with the honest grade for this one.
Thesis
We still see room for another advance, but we want the next recovery to hold rather than give sellers another opening. A cash SPX reclaim of 7,600 that survives a pullback would support that read; failure there and a loss of 7,550 would keep us cautious and shift attention to 7,500.
Weekly overview
SPX heads into the week at 7,580.07 after its worst day since June and a third straight losing week, with technology shares bearing the brunt of the latest selling (AP). That calls for some patience, but it doesn’t mean every rally is destined to fail.
The election and a busy economic calendar give the market plenty to react to (CNBC). We’re less interested in guessing the headlines than in seeing what buyers do when the next recovery gets tested. One green session won’t settle it; reclaiming ground and keeping it would tell us more.
That’s the starting point for this outlook. We’ll use the near-term positioning map to frame the recovery, then step back to the larger Elliott Wave structure and the three paths on our chart. Gold has a separate November 4-5 setup, with its own entry area and risk conditions rather than a borrowed SPX thesis.
SPX / ES structure
Cash SPX 7,600 is our first checkpoint. UW’s coming-week profile shows pronounced negative gamma there, which makes the reaction worth watching but doesn’t tell us that price must reject. Getting above it matters less than holding it on a pullback; we want the recovery to keep some progress rather than give back the first bounce.
This week’s cash SPX levels
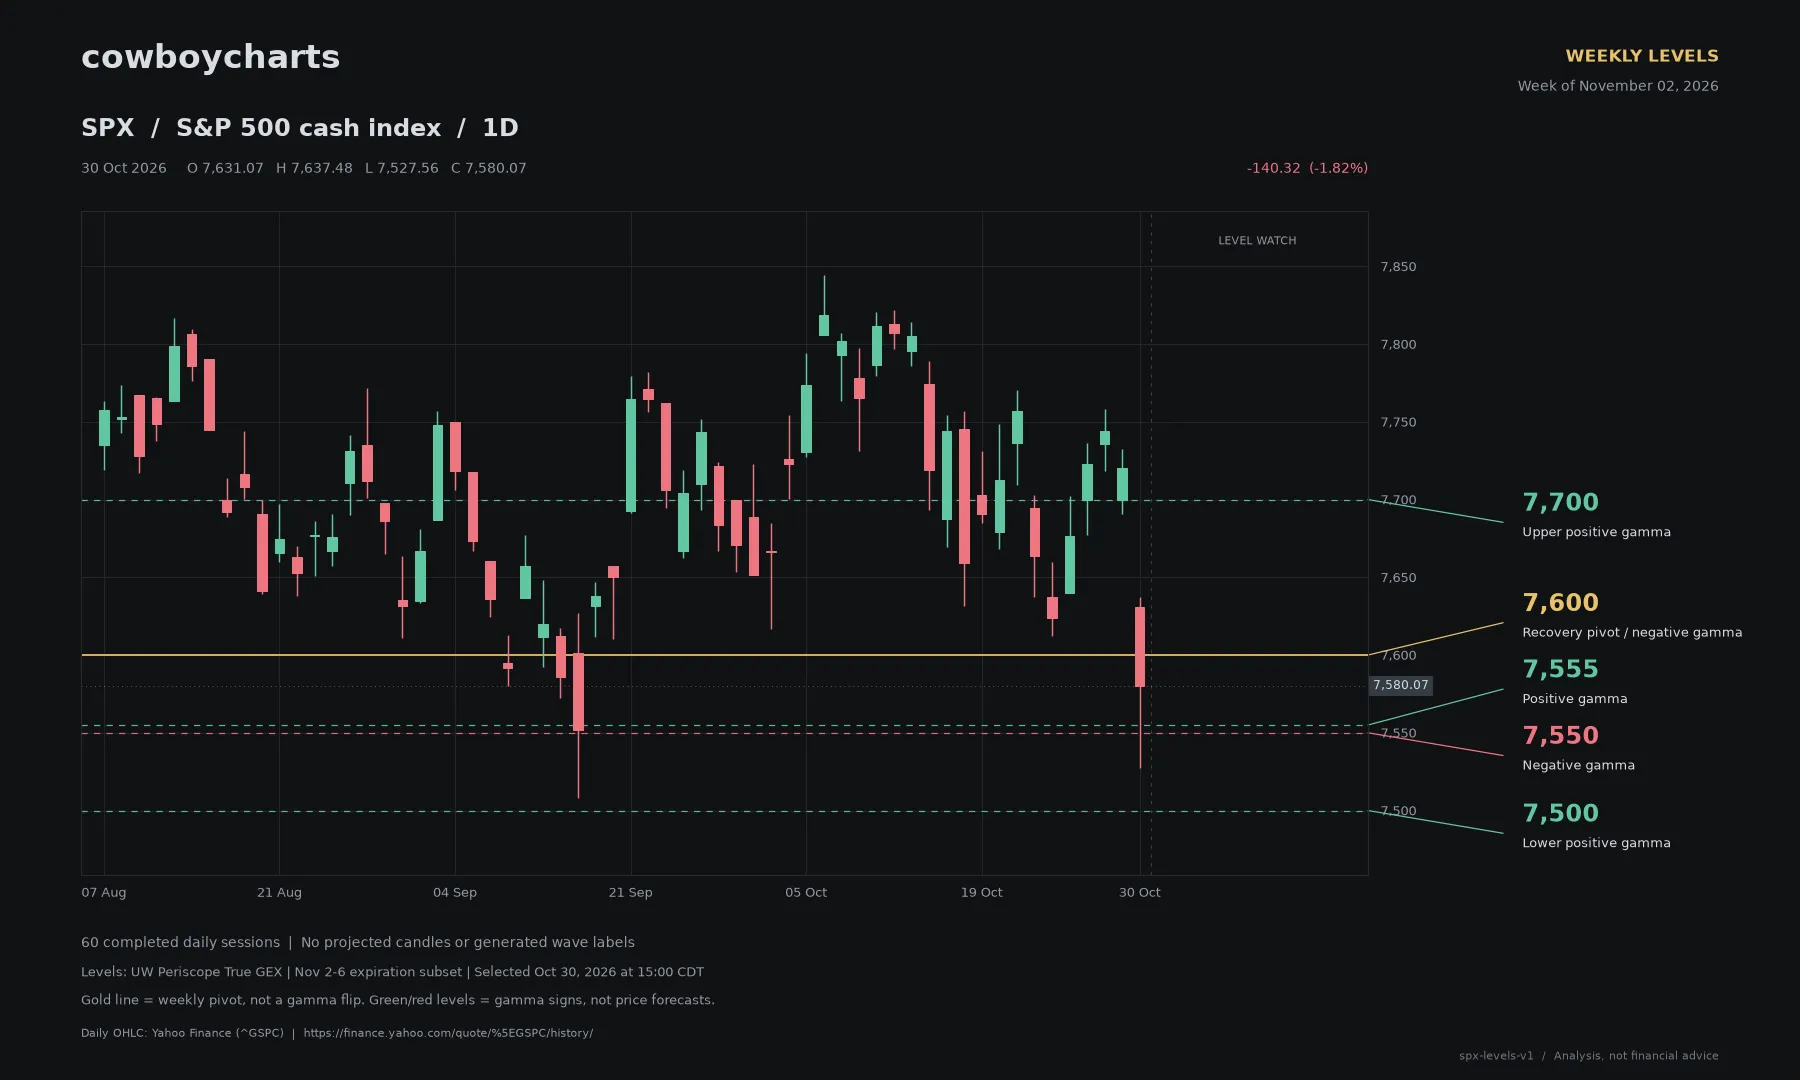 Chart: Cash S&P 500, daily, 60 completed sessions through October 30, 2026, using Yahoo Finance S&P 500 (^GSPC) historical OHLC data. Candles use actual open, high, low, and close data, not reconstructed screenshot prices or projected bars.
This is the near-term map to use alongside the larger count below. The gold line marks our 7,600 recovery pivot; the green and red level lines identify positive and negative gamma at the marked strikes, not bullish and bearish price forecasts. Those observations come from the supplied UW Periscope True GEX snapshot selected October 30 at 15:00 CDT for the November 2-6 expiration subset.
The 7,555 and 7,550 lines stay separate even though they are close together. This generated reference chart adds no wave labels, channel drawings, or forecast candles; the structure and three paths remain on Cowboy’s original chart.
The bigger count
Our daily chart follows the advance from the April 2025 low through waves (1), (2), and (3), with the current correction mapped as a developing wave (4). The A and B labels frame the correction so far; the projected C/(4) area is a possible destination, not a claim that the final low is already in.
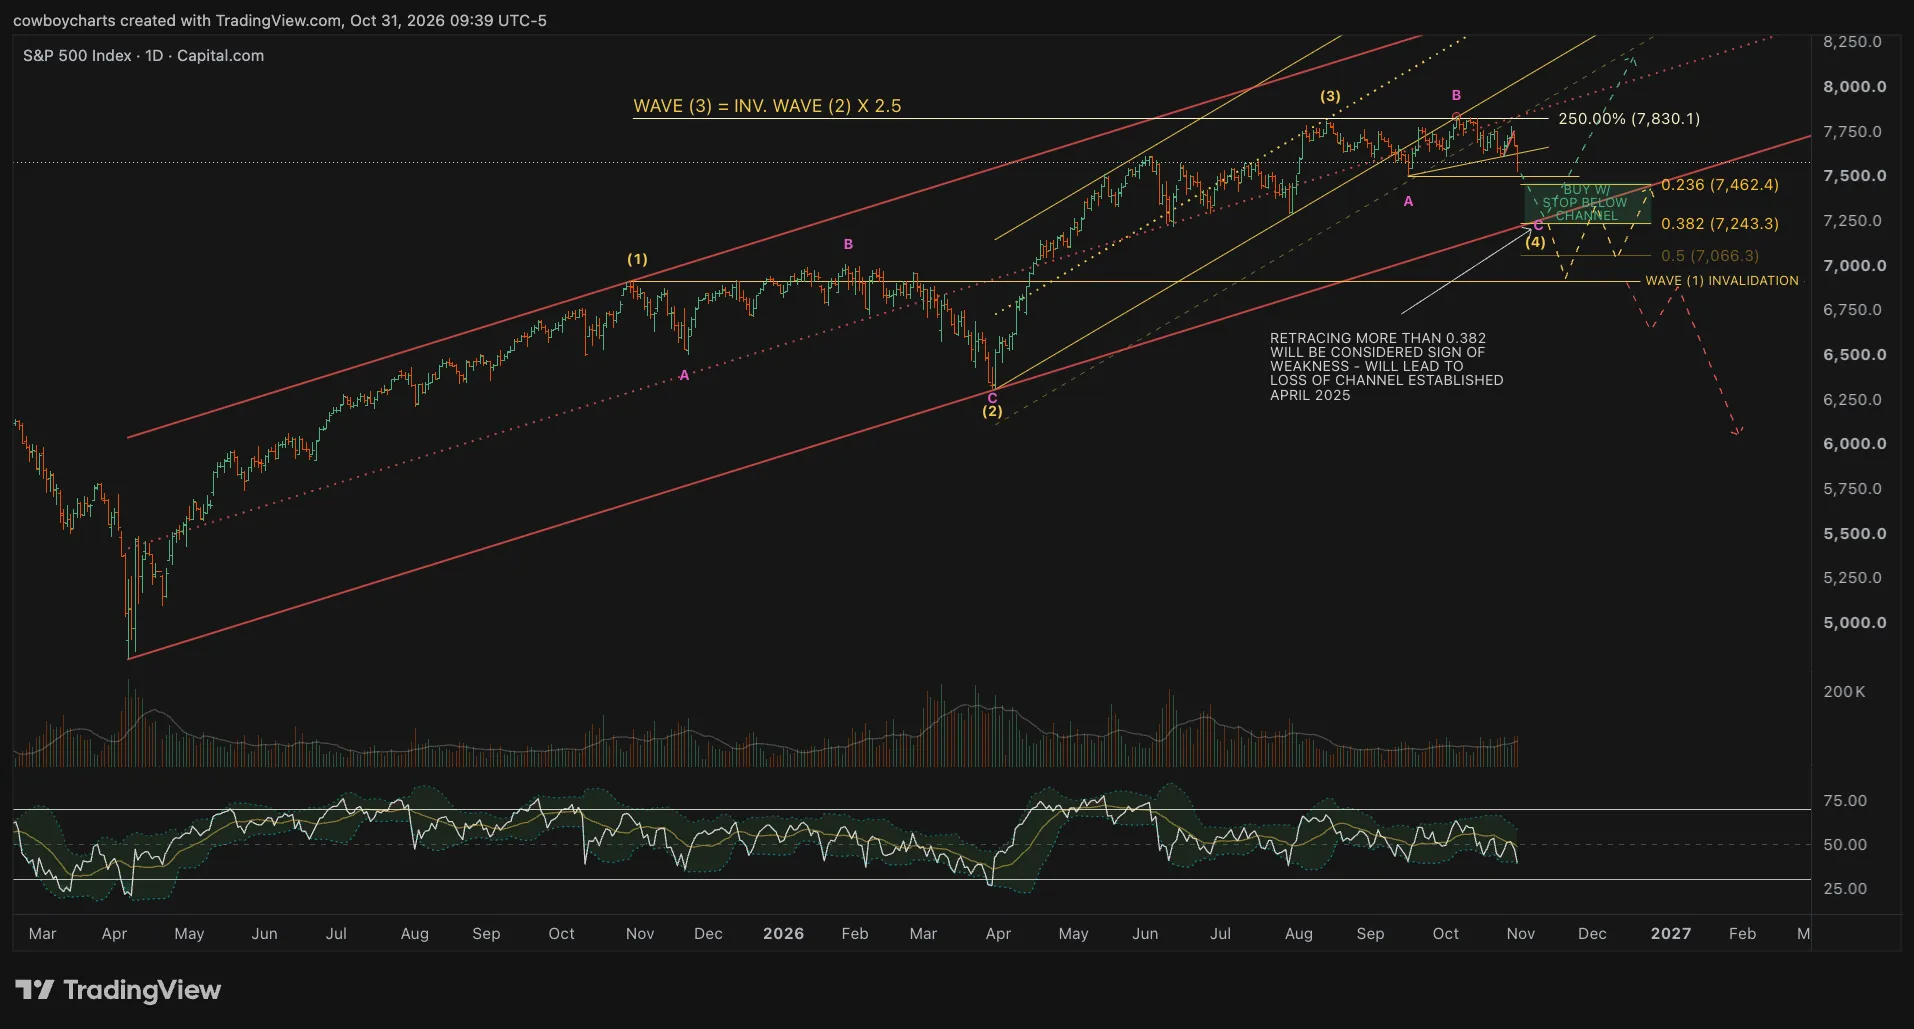 Chart: S&P 500 Index, daily, Capital.com feed. Cowboy’s original chart, stamped October 31, 2026 at 09:39 UTC-5; annotations unchanged.
The useful part of this chart is the decision map. The marked retracement area runs from 7,462.4 at 0.236 down toward 7,243.3 at 0.382. That gives us somewhere to watch for stabilization rather than buying a falling market just because it has reached a familiar ratio. The rising channel adds another test: we want to see buyers defend the structure, not just touch a line.
Green: the correction sets up another advance
The green path is the outcome we’re looking for if wave (4) finds its low and the larger advance resumes. It allows a further dip before the turn; bullish does not have to mean straight up from here. What would help is a rebound that starts holding its pullbacks and developing a cleaner upward structure instead of giving everything back.
The chart’s 7,830.1 projection is an upper reference if that recovery develops. We’re not treating it as a promise for this week, and the drawn path is not a calendar forecast. The immediate job is still to finish the correction and show that buyers can keep a recovery.
Yellow: more correction, not necessarily a broken trend
The yellow path is the patience case. Wave (4) can keep working sideways while rallies and declines retrace one another, without giving either side a clean trend to follow.
The 0.500 reference at 7,066.3 marks a deeper correction to reassess, not an automatic target or the point where the count necessarily dies. A drawn sideways route is not enough to confirm a particular Elliott pattern; we want the actual swings to develop before narrowing that label.
Red: where the larger read stops working
Our first warning is a deeper retracement through 0.382 and loss of the channel established from the April 2025 low. That would make the bullish interpretation less comfortable, even before the hard boundary is reached.
The structural line is different: the wave-(1) price territory marked on the chart. A standard impulse cannot keep a wave-(4) label once that overlap occurs. We would change the count rather than move the invalidation to accommodate the decline.
The exact price of that horizontal invalidation line isn’t printed in this screenshot, so we won’t manufacture a precise number for it. The red projection shows the risk of a larger breakdown; its endpoint is not a measured downside target.
This is a Capital.com S&P 500 chart, not cash SPX or CME ES. Its retracement prices stay attached to that feed. The cash-index GEX references above are a separate near-term map, not interchangeable chart ticks.
Positioning
Separating the coming week’s expirations changes the picture. The all-expiration Unusual Whales Periscope True GEX view has a pronounced negative gamma concentration near Friday’s displayed price, but the November 2-6 subset is more mixed. We don’t see a basis here for describing the whole coming week as a negative-gamma market.
UW describes this as market-maker net gamma at each strike, not a simple bullish-versus-bearish customer-flow score. Its hedging framework treats positive gamma as potentially dampening moves and negative gamma as potentially reinforcing them; neither sign guarantees the next price move. (Unusual Whales Periscope interpretation guide)
The clearest nearby contrast is 7,555 against 7,550. UW shows positive gamma at 7,555 and a pronounced negative bar just five points lower at 7,550. We’re not going to flatten that into a single support zone. A dip that gets rejected and recovers would tell us something different from price losing the area and failing to get back above it.
At 7,600, the extended view shows another pronounced negative concentration. That’s why we care about the quality of a reclaim, not just a quick trade above the number. If buyers recover it and hold a pullback, the positive concentration at 7,700 becomes an upper area to reassess. It isn’t a guaranteed destination or a confirmed call wall.
Below the nearest pair, 7,500 has positive gamma, but nearby strikes on either side also carry substantial negative exposure. We want to see how buyers respond there if the first recovery fails. The round number alone doesn’t make it a floor.
That fits the wave-(4) framework without choosing the outcome for it. A recovery that holds its pullbacks would help the green case; repeated retracements would keep yellow in play. Neither those options zones nor their loss replaces the actual Elliott invalidation on the larger chart.
These are Friday October 30 snapshots at the selected 15:00 CDT time, filtered to the coming week’s expirations rather than every contract remaining after Friday. They give us a useful local map, not Monday’s live book or a confirmed aggregate gamma regime. Exact exposure units and a modeled gamma flip have not been established.
Intermarket
One reason we’re not treating this as a simple “everything is breaking” story is that nearly as many S&P 500 stocks rose as fell on Friday, even as the tech-heavy index names dragged the headline lower. (AP) The confirmation we want from NQ is straightforward: if SPX bounces, does tech actually recover with it, or does the bounce run out of help?
For NQ, we want confirmation rather than a borrowed wave label. If it starts holding higher lows as the S&P correction stabilizes, that would help the green case. If it keeps rejecting rallies while SPX tries to recover, we’d be more prepared for the yellow path or another downward leg inside the correction. The S&P chart does not establish NQ’s degree or current wave.
Bonds caught a safety bid while oil rose on Friday. (AP) For the coming week, we’re watching whether easing yields actually help stocks stabilize, and whether oil adds another obstacle to the recovery.
Crypto has its own complication: Friday’s weakness followed the Binance hack, so we would be careful about treating every move in BTC as a clean signal for Monday’s equities. (AP) BTC can add context, but it doesn’t get to decide the SPX count.
Mega-caps
The issue is not that investors suddenly stopped caring about AI. It’s that they are asking harder questions about the cost: Alphabet’s cash spending, Amazon’s investment bill, and Intel’s outlook all featured in the latest selloff, while Nvidia was the biggest individual drag on the S&P on Friday. (AP)
We want to see whether those leaders can hold a recovery after the first bounce. A stock reclaiming a broken area and keeping it is more useful to us than a large opening gain that disappears by the close. That would support the idea that the index is finding its wave-(4) footing, although the individual stocks still need their own counts.
Apple, AMD, and Qualcomm are on the coming week’s earnings calendar, so there are fresh tests of that recovery beyond the election itself. (CNBC) We don’t need all three to tell the same story, but we want the reaction to good news to improve before getting comfortable with a broader bottom.
Gold: watching November 4-5 for a long
Spot gold is the other setup on the radar this week. We’re looking to buy a move into 3,755-3,770 during November 4-5, provided the reaction gives us a reasonable place to define risk. This is a price-and-time setup, not a call to buy simply because the calendar reaches Wednesday.
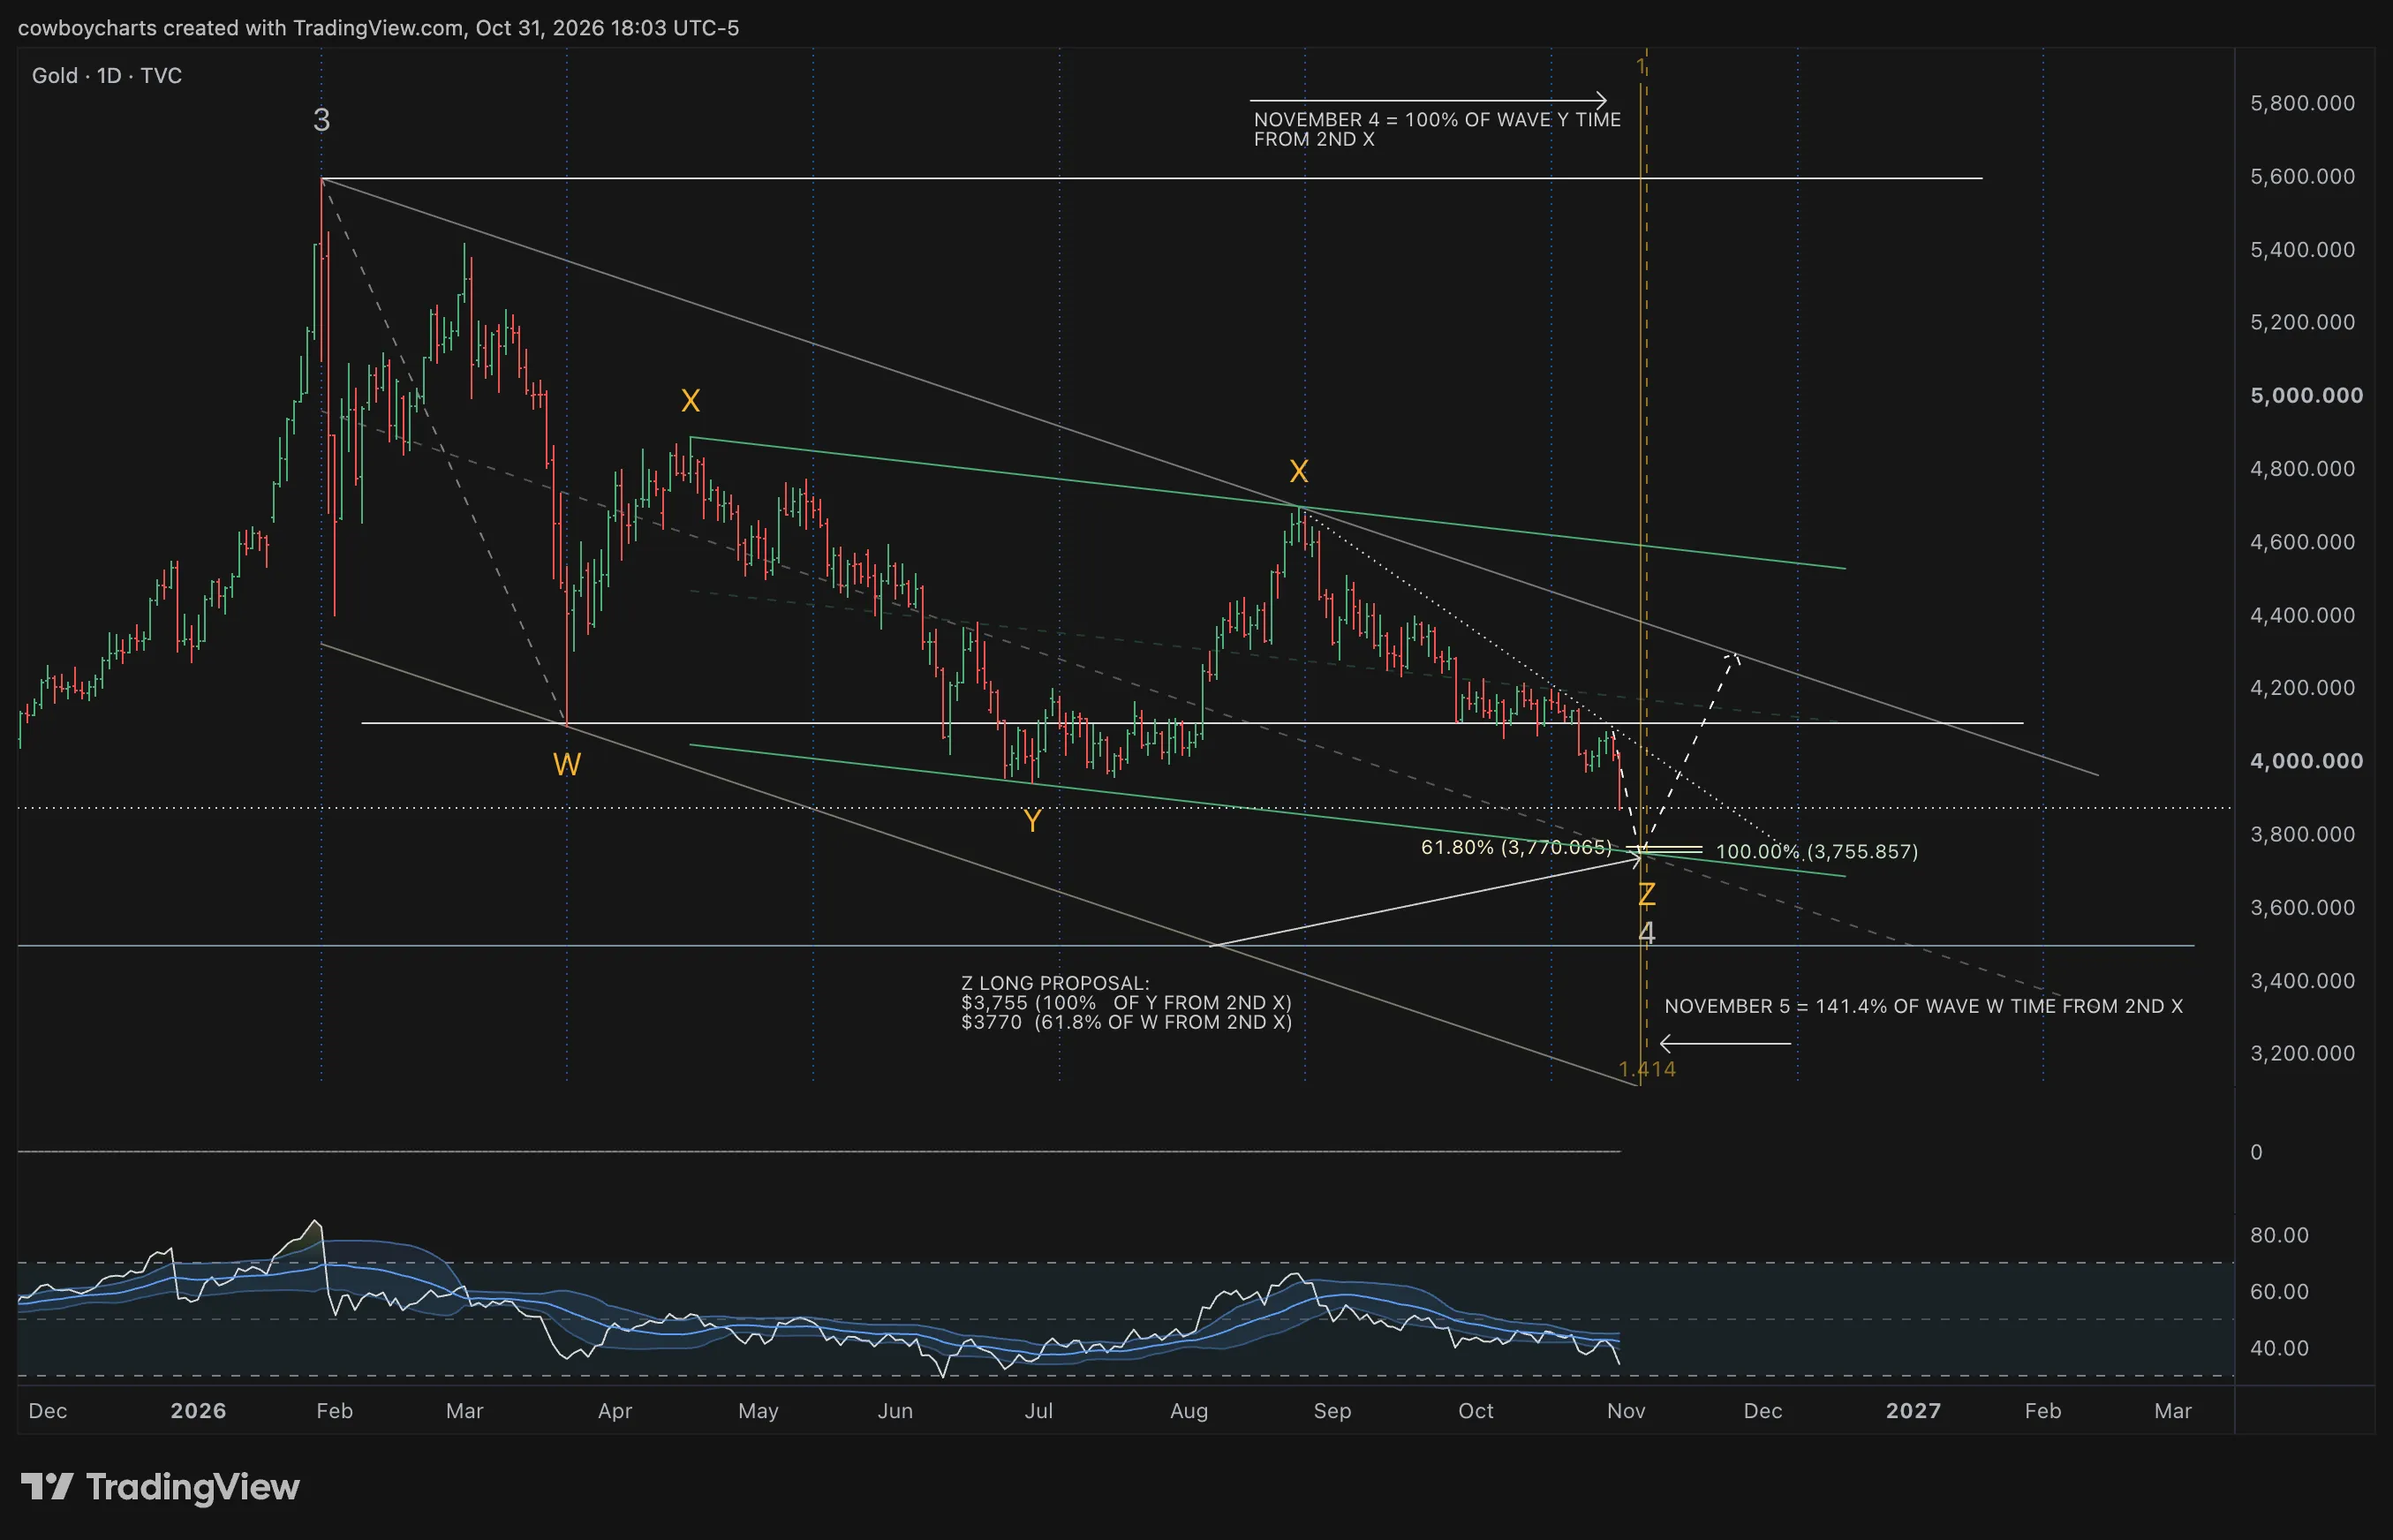 Chart: Gold, daily, TVC feed. Cowboy’s original chart, stamped October 31, 2026 at 18:03 UTC-5; annotations unchanged. The planned trade is spot gold.
The working count maps a W-X-Y-X-Z correction, with the proposed Z leg potentially finishing the larger wave 4. The appeal is the overlap of price projections, the lower channel area, and the November timing window. That puts a possible reversal on the watchlist; it doesn’t establish that Z has finished.
The chart projects 100% of Y from the second X at 3,755.857 and 61.8% of W from the same pivot at 3,770.065. Those marked projections frame the rounded 3,755-3,770 entry zone. The time markers add November 4 at 100% of Y’s duration from the second X, followed by November 5 at 141.4% of W’s duration from that pivot. These are the chart’s measured relationships, not a guarantee that the low arrives on either date.
The trade still needs a sensible stop. A push into the zone followed by rejection of lower prices and a reclaim would give us a developing low to work against; if price keeps sliding through, the zone alone isn’t a reason to keep buying. Stop placement needs to come from the actual entry setup, not from widening the risk until the trade looks comfortable.
The descending structure above price is the first recovery area to reassess if a turn develops. The dashed rebound is a scenario, not a measured profit target. If the price-and-time window passes without a usable reversal, we reassess rather than chase a trade that no longer fits the plan.
The intended trade is spot gold, not GC futures or GLD. The reference prices come from the TVC Gold chart above; the entry and stop must be checked against the spot-gold quote used for execution.
The week ahead
The calendar is busy enough without guessing the headlines: ISM manufacturing Monday, the midterms and JOLTS Tuesday, ADP and ISM services Wednesday, and the October jobs report Friday. (CNBC) We’re not building the outlook around a particular election result or payroll number. The test is whether the market can absorb those events and keep its recovery.
The plan is simple: keep the bigger wave-(4) picture in mind, but let the near-term recovery earn some trust. Green means the correction resolves and the advance can resume; yellow means it takes longer; red means the structure fails and the count has to change. Alongside that, gold has a specific November 4-5 window and 3,755-3,770 area to watch for a long with defined risk. Neither setup needs to be forced if the reaction isn’t there.
Disclosure
Not financial advice. This outlook is Cowboy’s own analysis and opinion, written for education and discussion. It is not a recommendation to buy or sell SPX, ES, spot gold or any other instrument mentioned, and it isn’t personalized advice.
The spot-gold long is Cowboy’s own plan for November 4-5. Cowboy may take, skip, size or exit that trade, or hold other positions in instruments discussed here, without notice. The entry area is not a signal to copy, and the stop has to come from your own setup and risk.
Levels, wave counts and the green, yellow and red paths are conditional, not forecasts or guarantees. Positioning comes from a Friday Unusual Whales snapshot and chart prices from third-party feeds; both can be stale or wrong by Monday, so check live quotes with your own broker. Election-week and jobs-report volatility can move price through any level quickly. Trading involves substantial risk of loss. Full disclosures
Scenarios
Bull case
SPX reclaims 7,600 and holds the first meaningful pullback, improving the recovery and bringing 7,700 into view as an area to reassess. On the larger chart, stabilization in or ahead of the marked retracement area would support the possibility that wave (4) is finishing and wave (5) can develop. The 7,830.1 chart projection is a later reference, not a promised weekly target.
Base case
Reclaims fail to stick and the swings keep overlapping, leaving wave (4) unfinished rather than establishing a sustained recovery. Watch reactions around the SPX 7,555/7,550 pair and, if tested, 7,500. More corrective work does not by itself invalidate the larger count or confirm a specific triangle/combination.
Bear case
SPX loses 7,550 and fails to recover it, increasing attention on 7,500 rather than confirming a floor there. On the larger chart, channel loss and a deeper retracement would weaken the bullish read; entry into wave (1)'s territory is the separate hard invalidation of the standard impulse count. A failed near-term recovery alone does not establish that structural break.